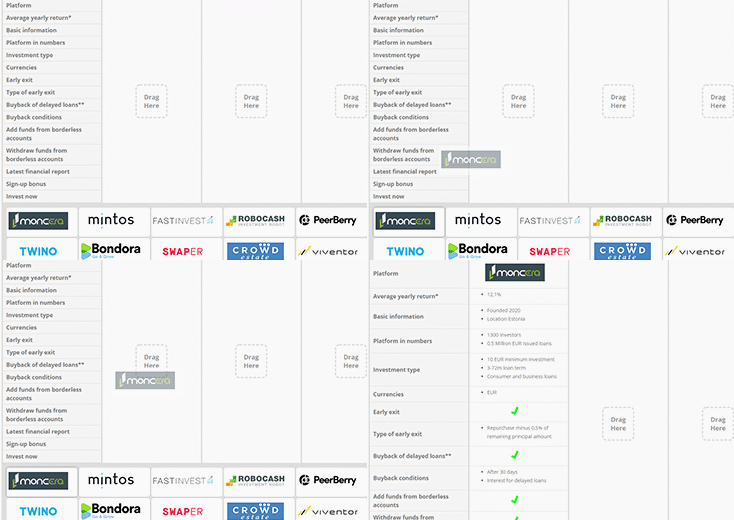
Compare peer to peer lending platforms from Europe, in the extensive table below. You will get the best overview of European peer to peer lending platforms as well as the possibility to sort through all the data. It is recommended to use your computer to look through the platforms, but its also possible using your mobile phone. The table will make it much easier for you to choose your next platform for investment. It’s showing the most important information about the platforms such as the average return, the number of investors, amount of loans issued, possibilities for an early exit and much much more. New platforms are constantly added and the data in the table is updated at least once a month with the latest changes. Simply press invest now to start your next investment adventure.
Go to the advanced drag and drop comparison tool to compare peer to peer lending platforms with even more details. Or check out the latest financial reports from the latest 3 years from all the platforms, before you chose where to invest your money here. Also, don’t forget to subscribe to the newsletter to get the latest blog posts and platforms updates.
This page is updated monthly (The information is last updated September 2022)
| Company | Launch year | Avg. return* | Investors | Issued loans | Early Exit | Buyback on delay** | Latest Financial report | Country | Sign-Up bonus | |
|---|---|---|---|---|---|---|---|---|---|---|
 | 2020 | 12.1% | 1300 | 0.5 Million € | Repurchase | Yes | 2019 | Estonia | 25EUR use code FB34OG3 | Invest now! |
 | 2020 | 12% | 1000 | 0.3 Million € | No | Yes | N/A | Cyprus | 20 EUR | Invest now! |
 | 2014 | 10.5% | - | - | No | Yes | - | Estonia | - | Invest now! |
 | 2015 | 10.41% | 424840 | 6914 Million € | Secondary market | Yes | 2018 | Latvia | 5EUR +1% | Invest now! |
 | 2017 | 12.1% | 10035 | 150 Million € | Secondary market | Yes | 2017 | Croatia | - | Invest now! |
 | 2017 | 13.85% | 21113 | 238 Million € | No | Yes | Waiting for info | Latvia | - | Invest now! |
 | 2008 | 6.75% | 133322 | 379 Million € | Repurchase | Yes | 2020 | Estonia | 5-25EUR | Invest now! |
 | 2014 | 17.05% | 47195 | 90 Million € | Secondary market | No | 2018 | Estonia | - | Invest now! |
 | 2009 | 10.59% | 20419 | 666 Million € | Repurchase | Yes | 2018 | Latvia | - | Invest now! |
 | 2016 | 12% | 3867 | 150 Million € | Secondary market | Yes | N/A | Latvia | - | Invest now! |
 | 2015 | 17.34% | 15885 | 29 Million € | Secondary market | No | Not public | Lithuania | - | Invest now! |
 | 2016 | 11% | 15837 | 131 Million € | Repurchase | Yes | 2018 | Latvia | - | Invest now! |
 | 2016 | 14.74% | 5561 | 12 Million € | No | No | Not Public | Latvia | - | Invest now! |
 | 2017 | 15.36% | 11716 | 31 Million € | No | Yes | Not public | Estonia | - | Invest now! |
 | 2019 | 10% | 800 | 0.5 Million € | Secondary market | No | N/A | Estonia | 15 EUR | Invest now! |
 | 2017 | 13.23% | 9422 | 43 Million € | Repurchase | Yes | 2018 | Czech Republic | 1% | Invest now! |
* The average return is based on the official information from the lending platforms and might have been calculated differently between the platforms.
** The buyback guarantee might only apply to a selection of the loans offered on the platforms for investing.
Don’t hesitate to contact us using the contact form if you have any questions on how to compare peer to peer lending platforms or if you have suggestions to the comparison tool or to new platforms you want to be added.
This table is not supported by Internet Explorer and its therefore recommended for you to use another browser use the comparison tool.

